Measuring Natural Phenomena
2.4. Measuring Natural Phenomena#
The scope diagram introduced for observing a target population can be extended to the situation where we want to measure a quantity, such as a particle count in the air, the age of a fossil, or the speed of light. In these cases, we consider the quantity we want to measure as an unknown, exact value. (This unknown value is often referred to as a parameter.) We can adapt our scope diagram to this setting: we shrink the target to a point that represents the unknown; the instrument’s accuracy acts as the access frame; and the sample consists of the measurements taken by the instrument. You might think of the frame as a dartboard, where the instrument is the person throwing the darts, and the darts land within the circle, scattered around the bullseye. The scatter of darts corresponds to the measurements taken by the instrument. The target point is not seen by the dart thrower, but ideally it coincides with the bullseye.
To illustrate the concept of measurement error and its connection to sampling error, we examine the problem of measuring CO2 levels in the air.
What is the level of CO2 in the air? CO2 is an important signal of global warming because it traps heat in the Earth’s atmosphere. Without CO2, the Earth would be impossibly cold, but it’s a delicate balance. An increase in CO2 drives global warming and threatens our planet’s climate. To address this question, CO2 concentrations have been monitored at Mauna Loa Observatory since 1958. These data offer a crucial benchmark for understanding the threat of global warming.
When thinking about the scope of the data, we consider the location and time of data collection. Scientists chose to measure CO2 on the Mauna Loa volcano because they wanted a place where they could measure the background level of CO2 in the air. Mauna Loa is in the Pacific Ocean, far away from pollution sources, and the observatory is high up on a mountain surrounded by bare lava, away from plants that remove CO2 from the air.
It’s important that the instrument measuring CO2 is as accurate as possible. Rigorous protocols are in place to keep the instrument in top condition. For example, samples of air are routinely measured at Mauna Loa by different types of equipment, and other samples are sent off-site to a laboratory for more accurate measurement. These measurements help determine the accuracy of the instrument. In addition, a reference gas is measured for 5 minutes every hour, and two other reference gases are measured for 15 minutes every day. These reference gases have known CO2 levels. A comparison of the measured concentrations against the known values helps identify bias in the instrument.
While the CO2 in background air is relatively steady at Mauna Loa, the five-minute average concentrations that are measured in any hour deviate from the hourly average. These deviations reflect the accuracy of the instrument and variation in airflow.
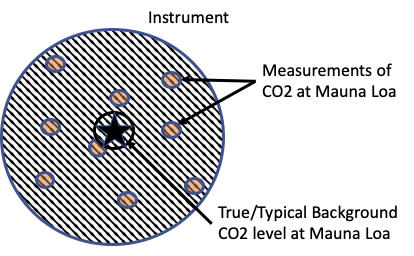
Fig. 2.4 The access frame represents the accuracy of the instrument; the star represents the true value of interest#
The scope for data collection can be summarized as follows: at this particular location (high up on Mauna Loa) during a particular one-hour period, there is a true background concentration of CO2; this is our target (see Figure 2.4). The instrument takes measurements and reports five-minute averages. These readings form a sample contained in the access frame, the dartboard. If the instrument is working properly, the bullseye coincides with the target (the one-hour average concentration of CO2) and the measurements are centered on the bullseye, with deviations of about 0.30 parts per million (ppm). The measurement of CO2 is the number of CO2 molecules per 1 million molecules of dry air, so the unit of measurement is ppm.)
We continue the dartboard analogy in the next section to introduce the concepts of bias and variation, describe common ways in which a sample might not be representative of the population, and draw connections between accuracy and the protocol.