Data Source Examples
Contents
8.1. Data Source Examples#
We have selected two examples to demonstrate file wrangling concepts: a government survey about drug abuse; and administrative data from the San Francisco Department of Public Health about restaurant inspections. Before we start wrangling, we give an overview of the data scope for these examples (see Chapter 2).
8.1.1. Drug Abuse Warning Network (DAWN) Survey#
DAWN is a national health-care survey that monitors trends in drug abuse. The survey aims to estimate the impact of drug abuse on the country’s health-care system and improve how emergency departments monitor substance abuse crises. DAWN was administered annually from 1998 through 2011 by the Substance Abuse and Mental Health Services Administration (SAMHSA). In 2018, due in part to the opioid epidemic, the DAWN survey was restarted. In this example, we look at the 2011 data, which have been made available through the SAMHSA Data Archive.
The target population consists of all drug-related emergency room visits in the US. These visits are accessed through a frame of emergency rooms in hospitals (and their records). Hospitals are selected for the survey through probability sampling (see Chapter 3), and all drug-related visits to the sampled hospital’s emergency room are included in the survey. All types of drug-related visits are included, such as drug misuse, abuse, accidental ingestion, suicide attempts, malicious poisonings, and adverse reactions. For each visit, the record may contain up to 16 different drugs, including illegal drugs, prescription drugs, and over-the-counter medications.
The source file for this dataset is an example of fixed-width formatting that requires external documentation, like a codebook, to decipher. Also, it is a reasonably large file and so motivates the topic of how to find a file’s size. And the granularity is unusual because an ER visit, not a person, is the subject of investigation.
The San Francisco restaurant files have other characteristics that make them a good example for this chapter.
8.1.2. San Francisco Restaurant Food Safety#
The San Francisco Department of Public Health routinely makes unannounced visits to restaurants and inspects them for food safety. The inspector calculates a score based on the violations found and provides descriptions of the violations. The target population here is all restaurants in San Francisco. These restaurants are accessed through a frame of restaurant inspections that were conducted between 2013 and 2016. Some restaurants have multiple inspections in a year, and not all of the 7,000+ restaurants are inspected annually.
Food safety scores are available through the city’s Open Data initiative, called DataSF. DataSF is one example of city governments around the world making their data publicly available; the DataSF mission is to “empower the use of data in decision making and service delivery” with the goal of improving the quality of life and work for residents, employers, employees, and visitors.
San Francisco requires restaurants to publicly display their scores (see Figure 8.1 for an example placard).1 These data offer an example of multiple files with different structures, fields, and granularity. One dataset contains summary results of inspections, another provides details about the violations found, and a third contains general information about the restaurants. The violations include both serious problems related to the transmission of foodborne illnesses and minor issues such as not properly displaying the inspection placard.
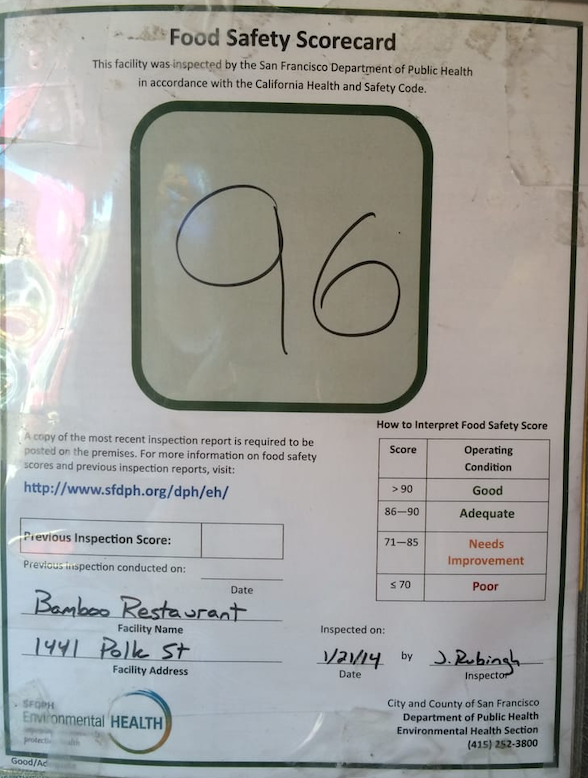
Fig. 8.1 A food safety scorecard displayed in a restaurant; scores range between 0 and 100#
Both the DAWN survey data and the San Francisco restaurant inspection data are available online as plain-text files. However, their formats are quite different, and in the next section, we demonstrate how to figure out a file format so that we can read the data into a dataframe.
- 1
In 2020, the city began giving restaurants color-coded placards indicating whether the restaurant passed (green), conditionally passed (yellow), or failed (red) the inspection. These new placards no longer display a numeric inspection score. However, a restaurant’s scores and violations are still available at DataSF.